Analysing grain growth in gradiented microstructures
Tools Learnt
- Surface Evolver
- Mathematica
Python Libraries Used
- Matplotlib
Techniques Used
- Voronoi Tesselation
- Linear Regression
- Pearson Correlation
Graphical Summary
Dataset:
-
Source: Grain metadata generated from Surface Evolver simulations.
-
Augmentation: None required, as the purpose of this study was to gain inference.
-
Data cleaning: None required.
Publication
This work resulted in a peer-reviewed publication.
Description
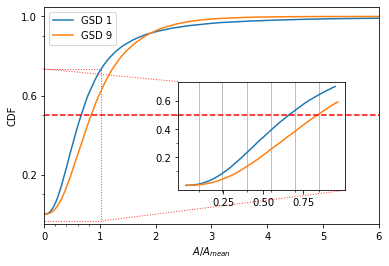
Surface Evolver was used to simulate grain growth under motion by mean curvature starting with non-uniform microstructures. The spatial variance in the initial microstructures were controlled through a spatially varying seeding method for the Voronoi Tesselation routine. Within the scope of the nomenclature of this work, GSD1 refers to the initial microstructure with the steepest gradient, and GSD9 refers to the initial microstructure with the most shallow gradient.
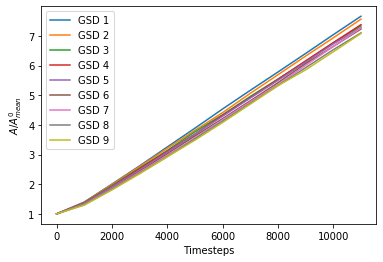
The slope of the area vs time was calculated using a linear regression fit. All the fits were obtained with a r^2 value greater than 0.99. The numerical fits obtained for each simulation is also shown below.

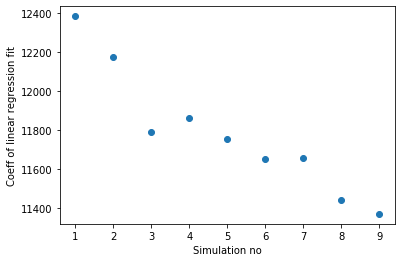
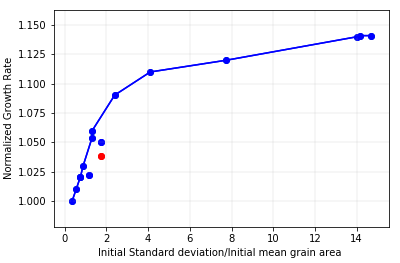
Correlation between a microstructure’s initial variance, a geometric property of the polycrystalline network, and its growth rate in the normal regime was calculated. As seen in the figure included in the graphical summary, it was observed that the microstructures evolved at different growth rates. The microstructures with the largest and smallest variances evolved with highest and lowest growth rates.
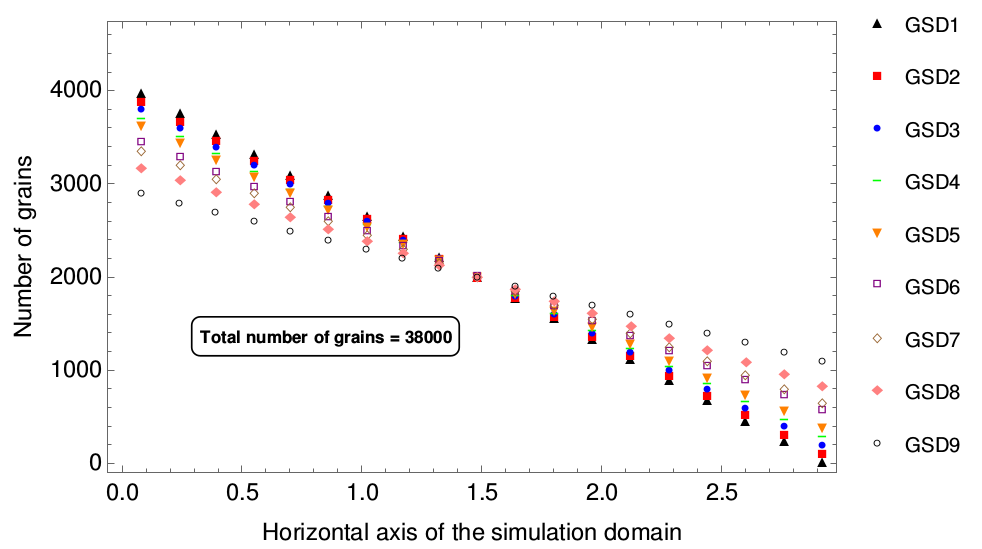
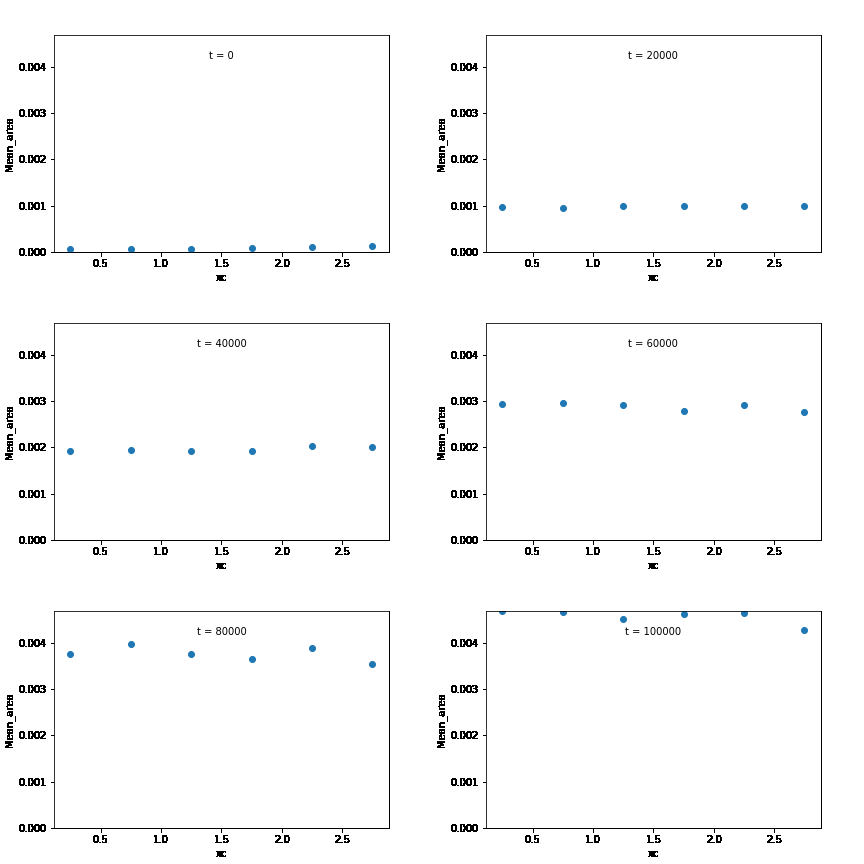
The temporal evolution of individual grain areas were visualized according to each grain’s x-centers. The evolution for GSD1 and GSD9 are shown below:
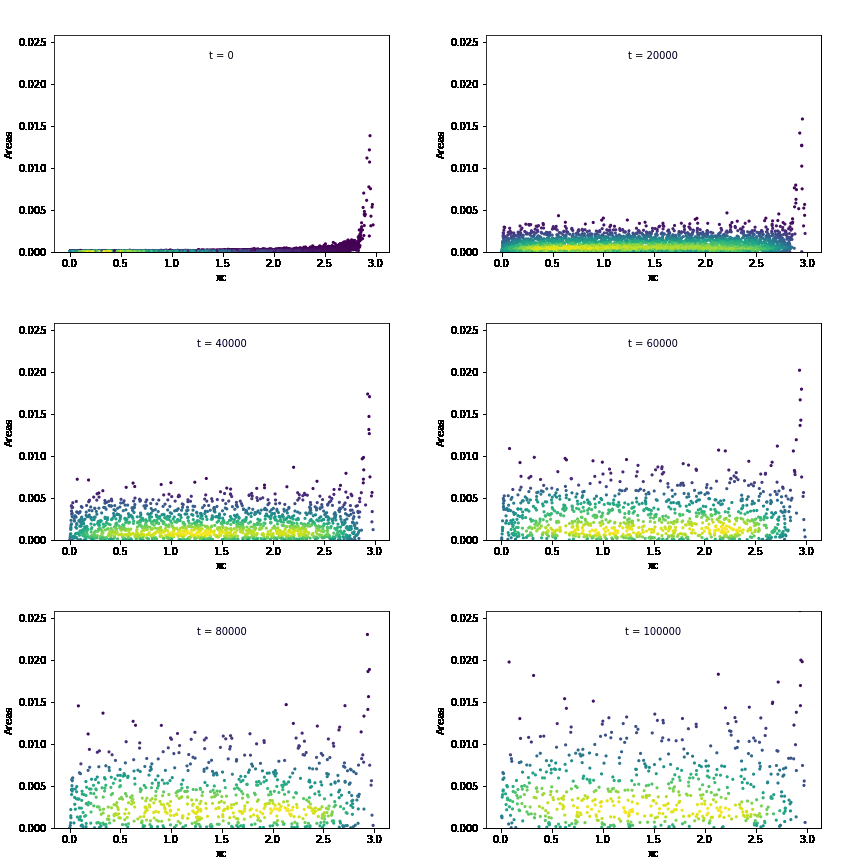
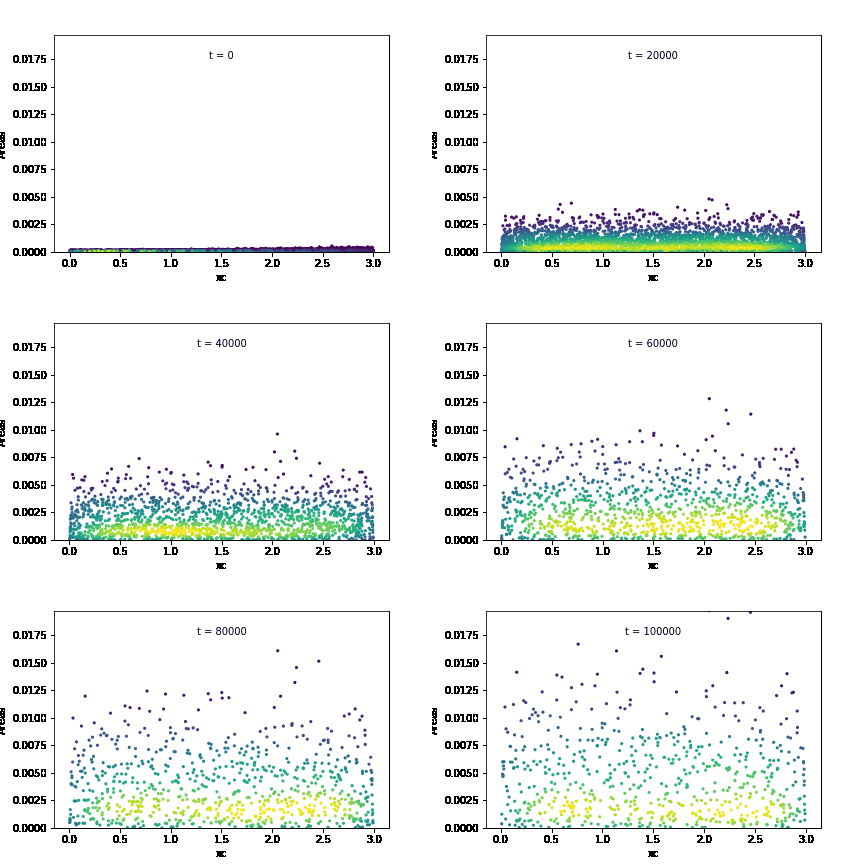
It is observed that the larger grains at the right-hand extreme of the domain are growing significantly faster in GSD1 than the larger grains at the right-hand extreme in GSD9. This was confirmed by calculating the average growth rates within each subdomain for the two cases:
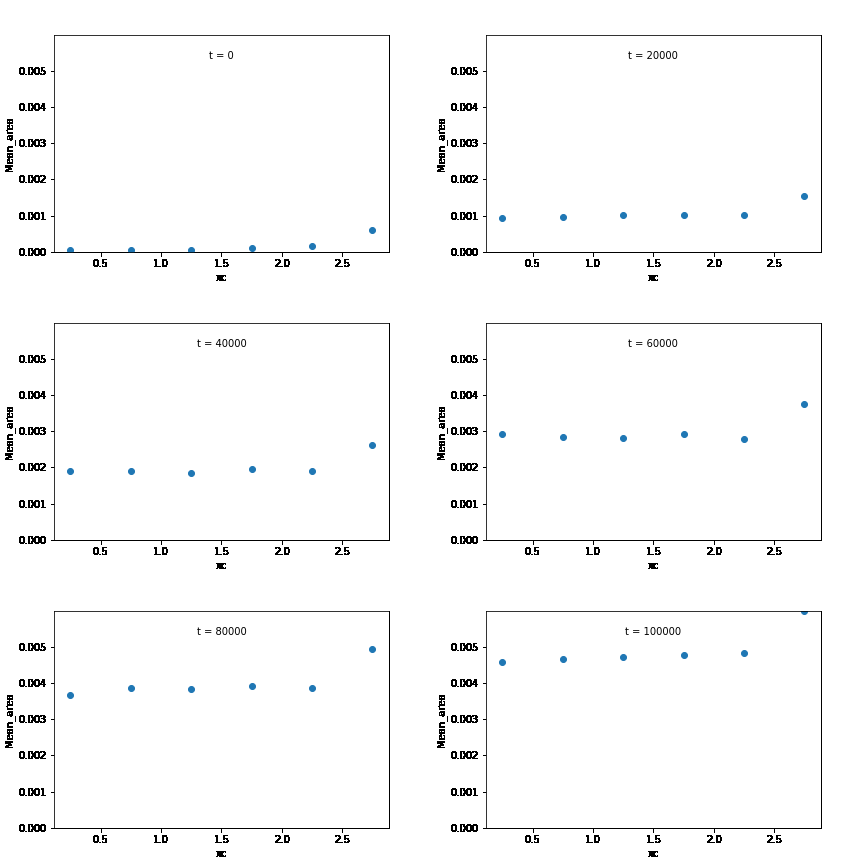
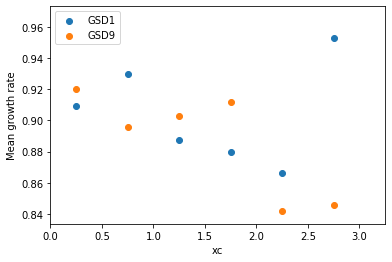
Mean grain area in the initial microstructure was calculated for each edge class, and was plotted according to their sub-domains. From these observations, it is likely that the increase in overall growth rate is brought about by an increase in the growth rate of the subdomain at the right extreme of the microstructure.
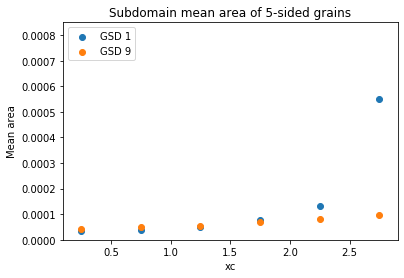
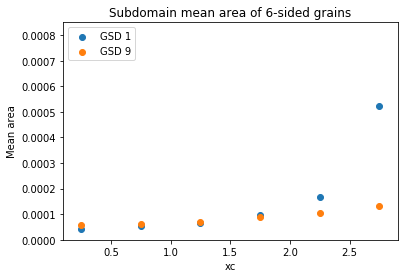
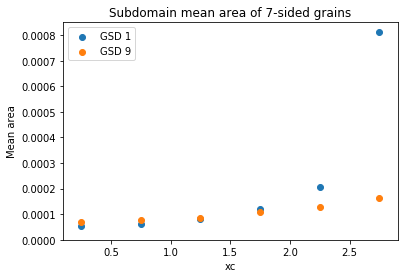
To strengthen this observation, statistical correlations were performed, between the mean growth rate and different topographical features such as mean area of n-sided grains, the number of n-sided grains, etc. The following table summarizes the Pearson correlation coefficients between the overall mean growth rate and the growth rate of 5-edged, 6-edged, and 7-edged grains in the different subdomains. SD1 refers to the left-most subdomain and SD6 refers to the right-most subdomain.
| 5-edged grains | 6-edged grains | 7-edged grains | |
|---|---|---|---|
| SD1 | 0.046 | -0.297 | 0.321 |
| SD2 | 0.278 | 0.404 | 0.051 |
| SD3 | -0.137 | -0.461 | -0.032 |
| SD4 | 0.366 | -0.268 | -0.426 |
| SD5 | -0.419 | -0.834 | -0.691 |
| SD6 | 0.751 | -0.285 | 0.955 |
The analysis was performed in the normal grain growth regime. These results highlight the importance of including the grain size variance when controlling microstructure using non-uniform thermal fields.